SuperTrend
get_super_trend(quotes, lookback_periods=10, multiplier=3)
Parameters
| name | type | notes |
|---|---|---|
quotes | Iterable[Quote] | Iterable of the Quote class or its sub-class. • See here for usage with pandas.DataFrame |
lookback_periods | int, default 10 | Number of periods (N) for the ATR evaluation. Must be greater than 1 and is usually set between 7 and 14. |
multiplier | float, default 3 | Multiplier sets the ATR band width. Must be greater than 0 and is usually set around 2 to 3. |
Historical quotes requirements
You must have at least N+100 periods of quotes to cover the warmup periods. Since this uses a smoothing technique, we recommend you use at least N+250 periods prior to the intended usage date for optimal precision.
quotes is an Iterable[Quote] collection of historical price quotes. It should have a consistent frequency (day, hour, minute, etc). See the Guide for more information.
Returns
SuperTrendResults[SuperTrendResult]
- This method returns a time series of all available indicator values for the
quotesprovided. SuperTrendResultsis just a list ofSuperTrendResult.- It always returns the same number of elements as there are in the historical quotes.
- It does not return a single incremental indicator value.
- The first
N-1periods will haveNoneSuperTrend values since there’s not enough data to calculate.
⚞ Convergence warning: the line segment before the first reversal and the first
N+100periods are unreliable due to an initial guess of trend direction and precision convergence for the underlying ATR values.
SuperTrendResult
| name | type | notes |
|---|---|---|
date | datetime | Date |
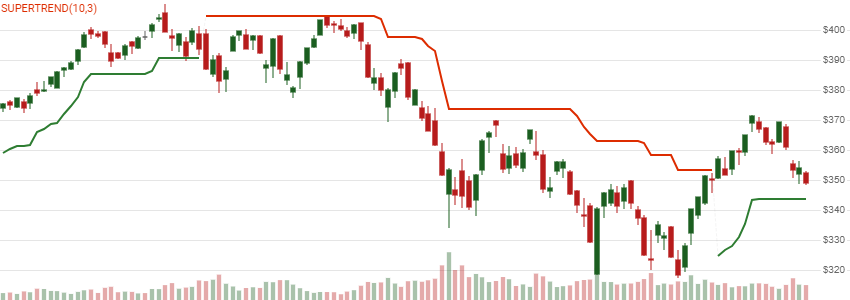
super_trend | Decimal, Optional | SuperTrend line contains both Upper and Lower segments |
upper_band | Decimal, Optional | Upper band only (bearish/red) |
lower_band | Decimal, Optional | Lower band only (bullish/green) |
upper_band and lower_band values are provided to differentiate bullish vs bearish trends and to clearly demark trend reversal. super_trend is the contiguous combination of both upper and lower line data.
Utilities
See Utilities and Helpers for more information.
Example
from stock_indicators import indicators

# This method is NOT a part of the library.
quotes = get_historical_quotes("SPY")

# calculate SuperTrend(14,3)
results = indicators.get_super_trend(quotes, 14, 3)
About SuperTrend
Created by Oliver Seban, the SuperTrend indicator attempts to determine the primary trend of Close prices by using Average True Range (ATR) band thresholds. It can indicate a buy/sell signal or a trailing stop when the trend changes. [Discuss] 💬