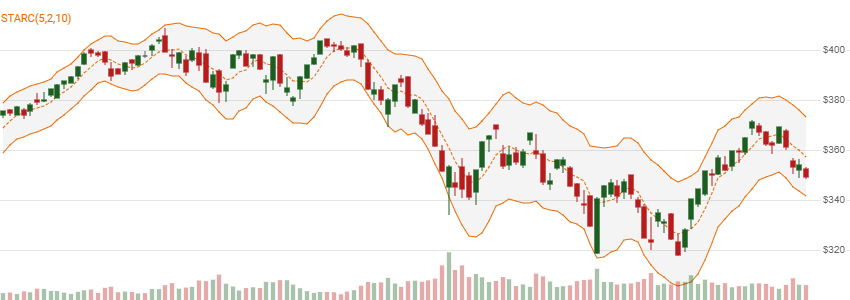
STARC Bands
get_starc_bands(quotes, sma_periods=20, multiplier=2.0, atr_periods=10)
Parameters
| name | type | notes |
|---|---|---|
quotes | Iterable[Quote] | Iterable of the Quote class or its sub-class. • See here for usage with pandas.DataFrame |
sma_periods | int | Number of lookback periods (S) for the center line moving average. Must be greater than 1 to calculate and is typically between 5 and 10. |
multiplier | float, default 2.0 | ATR Multiplier. Must be greater than 0. |
atr_periods | int, default 10 | Number of lookback periods (A) for the Average True Range. Must be greater than 1 to calculate and is typically the same value as sma_periods. |
Historical quotes requirements
You must have at least S or A+100 periods of quotes, whichever is more, to cover the convergence periods. Since this uses a smoothing technique, we recommend you use at least A+150 data points prior to the intended usage date for better precision.
quotes is an Iterable[Quote] collection of historical price quotes. It should have a consistent frequency (day, hour, minute, etc). See the Guide for more information.
Return
STARCBandsResults[STARCBandsResult]
- This method returns a time series of all available indicator values for the
quotesprovided. STARCBandsResultsis just a list ofSTARCBandsResult.- It always returns the same number of elements as there are in the historical quotes.
- It does not return a single incremental indicator value.
- The first
N-1periods will haveNonevalues since there’s not enough data to calculate, whereNis the greater ofSorA.
⚞ Convergence warning: The first
A+150periods will have decreasing magnitude, convergence-related precision errors that can be as high as ~5% deviation in indicator values for earlier periods.
STARCBandsResult
| name | type | notes |
|---|---|---|
date | datetime | Date |
upper_band | float, Optional | Upper STARC band |
center_line | float, Optional | SMA of Close price |
lower_band | float, Optional | Lower STARC band |
Utilities
See Utilities and Helpers for more information.
Example
from stock_indicators import indicators

# This method is NOT a part of the library.
quotes = get_historical_quotes("SPY")

# Calculate StarcBands(20)
results = indicators.get_starc_bands(quotes, 20, 2.0, 10)
About STARC Bands
Created by Manning Stoller, the Stoller Average Range Channel (STARC) Bands, are price ranges based on an SMA centerline and ATR band widths. See also Keltner Channels for an EMA centerline equivalent. [Discuss] 💬