Pivots
get_pivots(quotes, left_span=2, right_span=2, max_trend_periods=20, end_type=EndType.HIGH_LOW)
Parameters
| name | type | notes |
|---|---|---|
quotes | Iterable[Quote] | Iterable of the Quote class or its sub-class. • See here for usage with pandas.DataFrame |
left_span | int, default 2 | Left evaluation window span width (L). Must be at least 2. |
right_span | int, default 2 | Right evaluation window span width (R). Must be at least 2. |
max_trend_periods | int, default 20 | Number of periods (N) in evaluation window. Must be greater than leftSpan. |
end_type | EndType, default EndType.HIGH_LOW | Determines whether close or high/low are used to find end points. See EndType options below. |
The total evaluation window size is L+R+1.
Historical quotes requirements
You must have at least L+R+1 periods of quotes to cover the warmup periods; however, more is typically provided since this is a chartable candlestick pattern.
quotes is an Iterable[Quote] collection of historical price quotes. It should have a consistent frequency (day, hour, minute, etc). See the Guide for more information.
EndType options
from stock_indicators.indicators.common.enums import EndType
| type | description |
|---|---|
CLOSE | Chevron point identified from close price |
HIGH_LOW | Chevron point identified from high and low price (default) |
Return
PivotsResults[PivotsResult]
- This method returns a time series of all available indicator values for the
quotesprovided. PivotsResultsis just a list ofPivotsResult.- It always returns the same number of elements as there are in the historical quotes.
- It does not return a single incremental indicator value.
- The first
Land lastRperiods inquotesare unable to be calculated since there’s not enough prior/following data.
👉 Repaint warning: this price pattern looks forward and backward in the historical quotes so it will never identify a pivot in the last
Rperiods ofquotes. Fractals are retroactively identified.
PivotsResult
| name | type | notes |
|---|---|---|
date | datetime | Date |
high_point | Decimal, Optional | Value indicates a high point; otherwise None is returned. |
low_point | Decimal, Optional | Value indicates a low point; otherwise None is returned. |
high_line | Decimal, Optional | Drawn line between two high points in the max_trend_periods |
low_line | Decimal, Optional | Drawn line between two low points in the max_trend_periods |
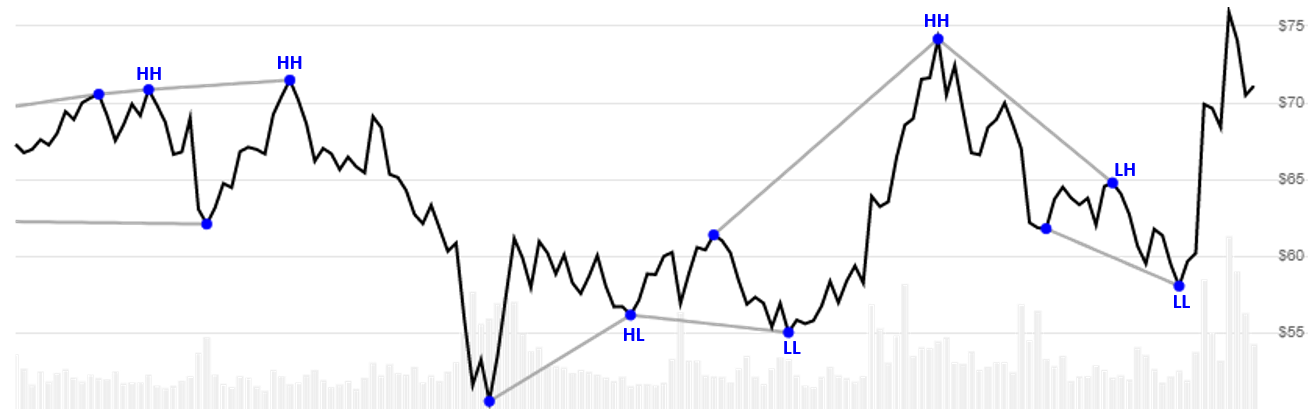
high_trend | PivotTrend, Optional | Enum that represents higher high or lower high. See PivotTrend values below. |
low_trend | PivotTrend, Optional | Enum that represents higher low or lower low. See PivotTrend values below. |
PivotTrend values
from stock_indicators.indicators.common.enums import PivotTrend
| type | description |
|---|---|
PivotTrend.HH | Higher high |
PivotTrend.LH | Lower high |
PivotTrend.HL | Higher low |
PivotTrend.LL | Lower low |
Utilities
See Utilities and Helpers for more information.
Example
from stock_indicators import indicators
from stock_indicators import EndType     # Short path, version >= 0.8.1

# This method is NOT a part of the library.
quotes = get_historical_quotes("SPY")

# Calculate Pivots(2,2,20) using High/Low values
results = indicators.get_pivots(quotes, 2, 2, 20, EndType.HIGH_LOW);
About Pivots
Pivots is an extended version of Williams Fractal that includes identification of Higher High, Lower Low, Higher Low, and Lower Low trends between pivots in a lookback window. [Discuss] 💬